myModel <- '
 # latent variables
   ind60 =~ x1 + x2 + x3
   dem60 =~ y1 + y2 + y3 + y4
   dem65 =~ y5 + y6 + y7 + y8
 # regressions
   dem60 ~ ind60
   dem65 ~ ind60 + dem60
 # residual covariances
   y1 ~~ y5
   y2 ~~ y4 + y6
   y3 ~~ y7
   y4 ~~ y8
   y6 ~~ y8
'
fit <- sem(model = myModel,
           data = PoliticalDemocracy)
summary(fit)About lavaan
News:
(16 July 2026): lavaan version 0.7-2 has been released on CRAN. This a major update introducing many changes and a few notable new features. See Version History for more information.
(17 June 2026): As part of an NWO-funded project for Dutch open-science infrastructural development, we are looking for a researcher/junior postdoc for the lavaan project. The job ad can be found on the University of Twente (UT) website. The deadline is 31 July 2026. The proposal for the full project can be found on Zenodo. The post-doc position above is part of Work Package 2 (WP2).
(5 Dec 2025): two new tutorials are available: “How to evaluate theory-based hypotheses in a lavaan model using the GORICA”, and “A Tutorial for Understanding SEM using R: Where Do All the Numbers Come From?”
What is lavaan?
The lavaan package is developed to provide useRs, researchers and teachers a free open-source, but commercial-quality package for latent variable modeling. You can use lavaan to estimate a large variety of multivariate statistical models, including path analysis, confirmatory factor analysis, structural equation modeling and growth curve models.
TipThe official reference to the lavaan package is the following paper:
Yves Rosseel (2012). lavaan: An R Package for Structural Equation Modeling. Journal of Statistical Software, 48(2), 1-36. URL http://www.jstatsoft.org/v48/i02/
First impression
To get a first impression of how lavaan works in practice, consider the following example of a SEM model. The figure below contains a graphical representation of the model that we want to fit. 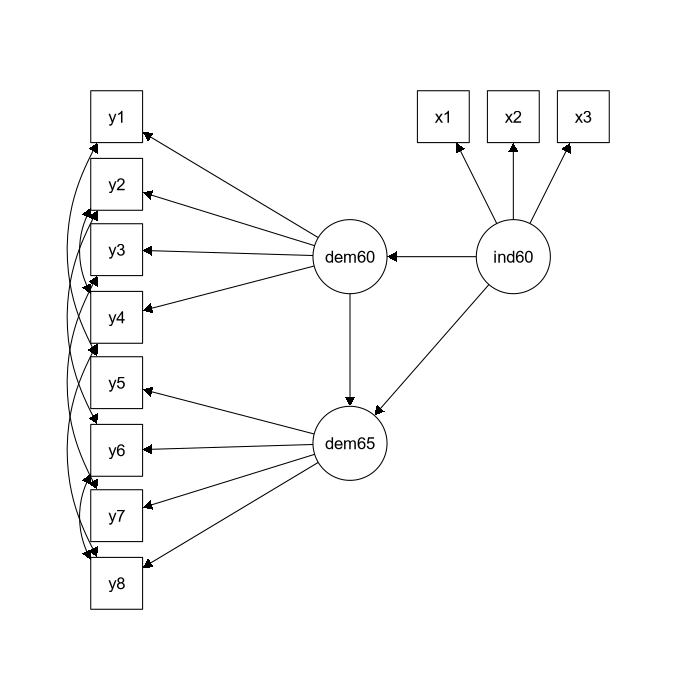
This is the corresponding lavaan model syntax: